Vision Intelligent Operations is a monitoring tool that has been developed in-house at Dell EMC specifically the old VCE now CPSD org. In its first few iterations, it was a single VM that would connect to all the components in a Vblock and pull back the relevant code version. The GUI information was displayed via a plugin for the vSphere WebClient. In terms of functionality, a user could run an RCM compliance scan which would indicate if the Vblock was still compliant or the versions had drifted over time.
Nowadays Vision has evolved in multi-VM deployment and functionality has increased to include Health Monitoring, Security Monitoring as well has Life Cycle Management. The VMs consist of –
Vision Core – Slib – System Libray
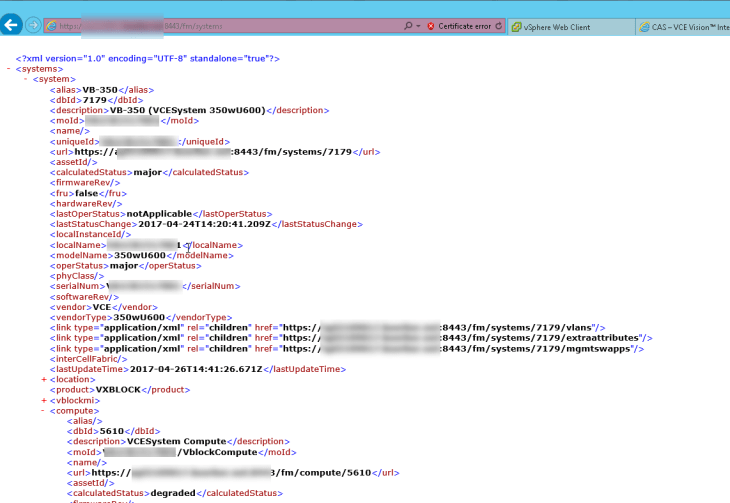
This is a RHEL VM that stores all the Vblock configuration details. This can be easily read by navigating the .xml file structure which can be accessed via
https://hostname:8443/fm/vblocks – for Vblocks
or
https://hostname:8443/fm/systems for VxBlocks, VxRack
All SNMP traffic within a V(x)Block system will be configured to point to this VM. Where further northbound addresses can be configured for external monitoring.
The Discovery mechanism is also located within the VM. An easy to configure answer file can be ingested via command line to discover each component and validate the connection information is correct. Once connection validation is complete the slib will discover each component and pull back device information. Such as
- Serial number
- Firmware Level
- Operations Status
Each URL can be viewed to gather further details if required. Example: following the URL highlighted below will expand details on the UCS Computer System.
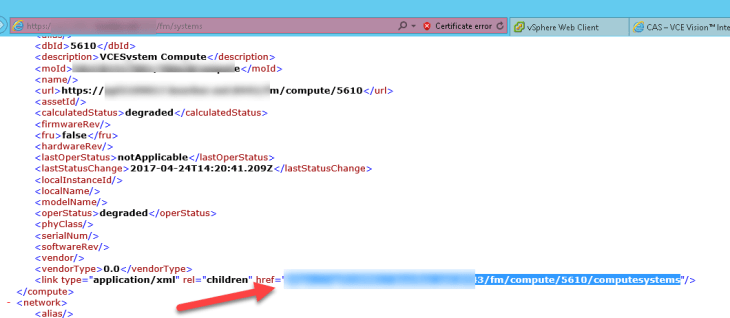
I have marked a few important values. Namely Firmware Version and operational status.
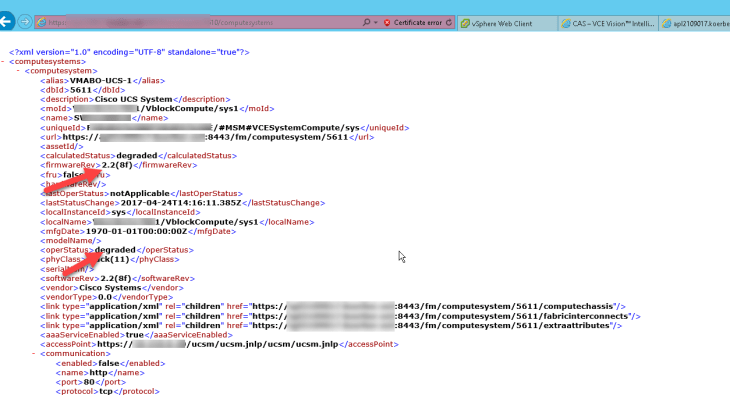
Is worth pointing out at this point that anything bar a perfectly configured system will give a degraded state. A few examples of these
- Unconfigured port on a Nexus, UCS, or MDS that are in a no shut state.
- SSH enabled on an ESXI host – in fact, any warning on an ESXI host will cause a degraded state ie “The number of heartbeat datastores for a host is 1, which is less than required: 2” etc.
Vision MSM – Multi-System Manager.
The MSM VM again is a RHEL appliance. It is the GUI for the Vision system and is a welcome change from the previous Web Client plugin. From here all the information that has been captured via the core can be viewed in graphical form.
The Main features here are
- RCM Compliance reporting. MSM OVA will power on with the latest versions of each RCM. Future RCM can be added as of when they are released and existing RCM can be tailored to included and firmware version that has been included in the RCM Addendum files.
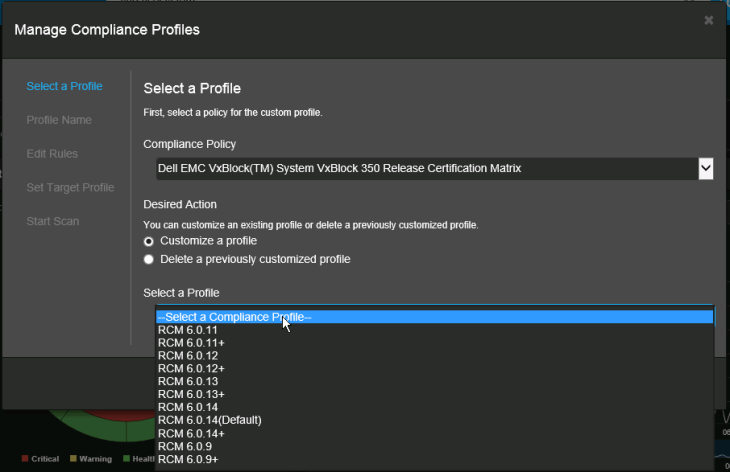
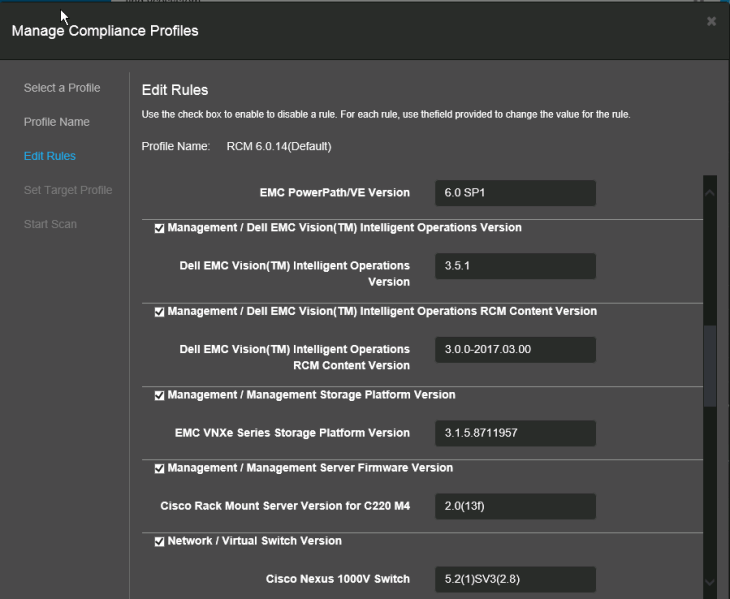
Once a reference RCM has been configured and set a default you can then run a scan based on the referenced values.
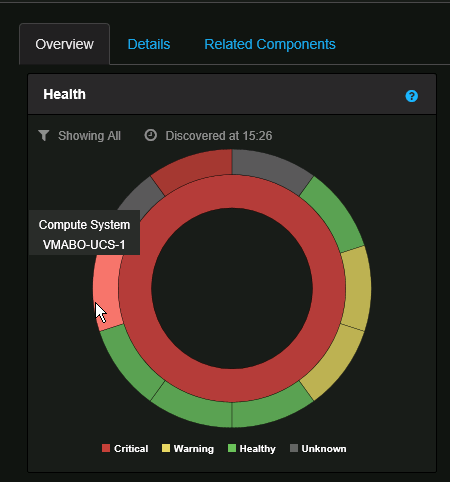
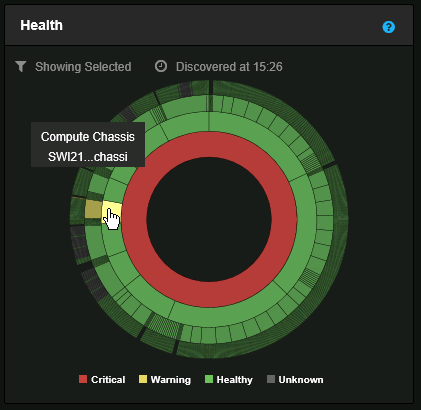
- Health – Is shown as a sunburst chart. Each component is represented by a segment which changes color dependent on the state of each device, It is as simple as Green is good, Red is bad and yellow is meh … A bad subcomponent will bubble up to give the whole component as degraded such as faulty blade will show the whole UCS as degraded and in turn, the whole Vblock will be degraded.
In this example, we notice that UCS is degraded. We can double click on the Item and drill down to get a closer view of what is causing the issue.
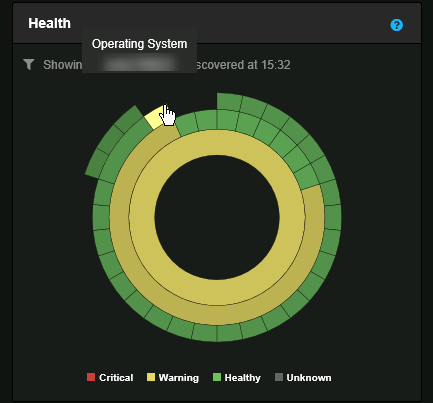
We notice that one of the hosts is flag yellow. Again let’s drill down for a closer inspection.
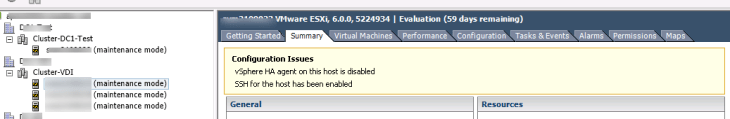
The O/S is flagged as being the issue. This particular node is sitting on a VDI cluster and I know one of the team is currently configuring the NVidia drivers so my bet is that the SSH is enabled
Yep just as I suspected. Once I disable SSH/Disable HA and wait for a system rescan approx every 15 mins. My health should revert to green for this item
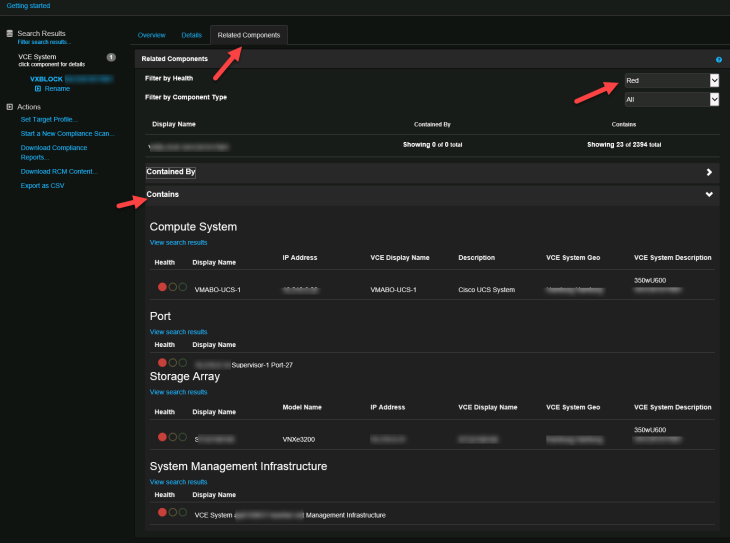
Alternatively, you can view all systems with inoperable statuses from the related components tab. Just filter health as Red.
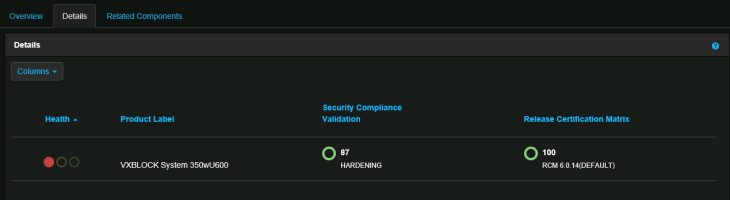
- Security Compliance Reporting – Based on DellEMC CSPD hardening guides for individual components. The report scans each device to ensure the setting is configured. Similarly, the settings can be tailored or modified based off of customer specific requirements if they differ from recommended best practices.
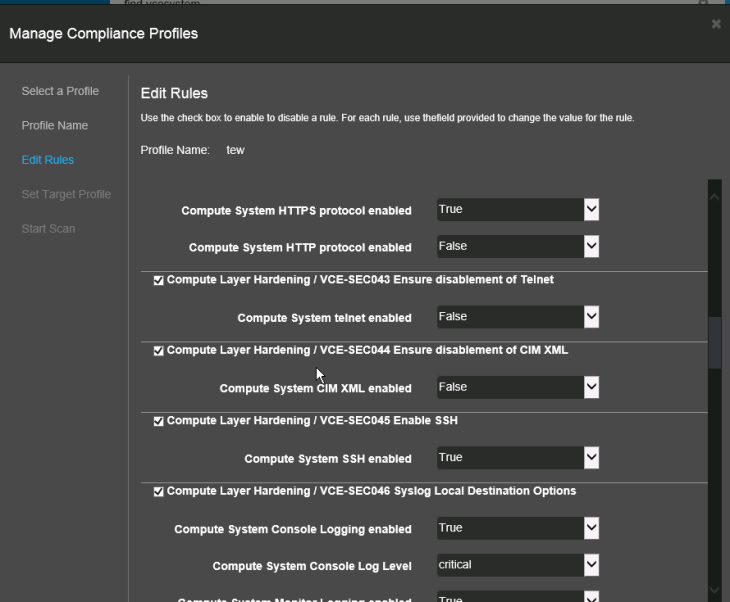
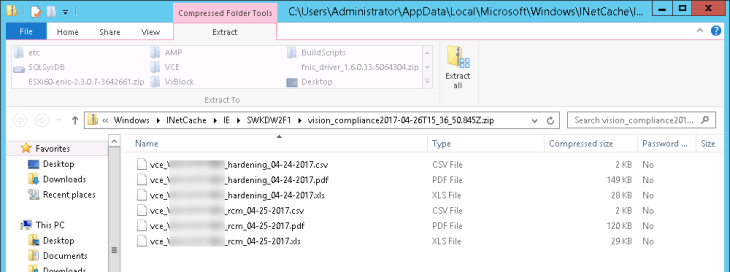
Both Security and RCM Compliance Results can be saved post scan and results are displayed in an easy to read PDF, CSV and XLS file.
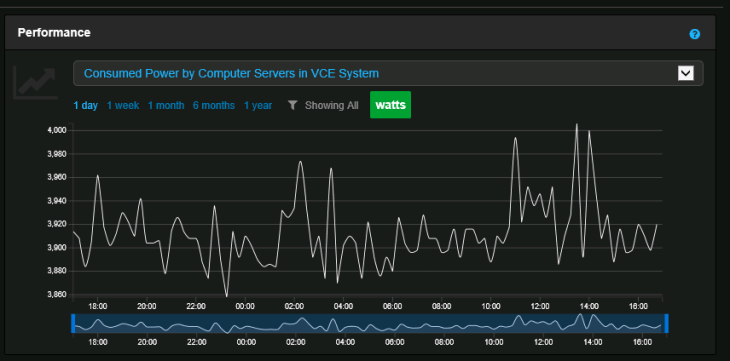
- Some Key Performance Indicators – KPIs
There is current work under way to develop what the systems designers are calling MSP – This is third VM that will be used for storing RCM Files and auto upgrade components in the VBlock system.
